• Skip to main navigation
  • Skip to content
  • Skip to primary sidebar
  • Skip to footer

Doiron Realty ServicesDoiron Realty Services

On the Gulf Coast

  • Home
  • Contact Us
  • Gulf Front Condos 33708
  • Gulf Coast R.E. News
  • Real Estate Commission Lawsuit
SearchClose

Florida Association of REALTORS Sue the CDC

It’s the largest group of Realtors in Florida and the third such group to sue the CDC in the last few months. The suit challenges the CDC’s eviction ban and the “draconian penalties” it imposes, as well as the application of CDC’s authority in general. The lawsuit also alleges the CDC’s ban took action to protect tenants — but took none to protect landlords, many of whom are also struggling due to the pandemic.

“The CDC’s order does not relieve landlords from their obligations to pay property taxes, make their own mortgage payments on rental properties, or provide maintenance and upkeep necessary to comply with applicable laws or regulations,”

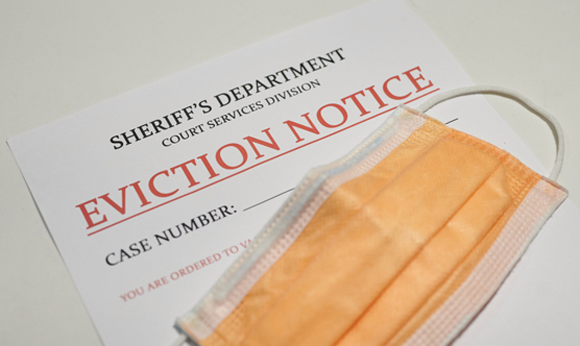
The consequences of violating the CDC’s Eviction Moratorium can be severe. The Eviction Moratorium imposes criminal penalties on landlords who violate it. Individuals face a maximum fine of $100,000, one year incarceration, or both; companies face a maximum fine of $200,000 per eviction. If the eviction results in a death, the maximum fine increases to $250,000 and $500,000, respectively.

Though no court date has yet been set, the case will likely move fast, as the CDC’s ban is set to expire on June 30.

Posted in: Uncategorized

Tampa Bay 4th in the Nation for New Residents

The Tampa Bay Metro had the Fourth Biggest Net Inflow of New Residents in the United States. Net inflow of New Residents in 2020 was 47,000, coming in 4th place after Phoenix, Dallas and Orlando Metro’s. The number of homes for sale dropped 31% year over year. New Home Building Permits dropped 25.3%. Prices up 12.2%

Source: US Census Bureau data and Redfin search data
Send In Blue Newsletter 6-1-2021

Posted in: Uncategorized

Interest Rates Down Cash Sales Up… Wait What?

All-cash sales of existing homes in the U.S. comprised 25% of transactions in April as competition in the housing market continued. This marks an increase from 15% of similar sales a year ago and 20% in 2019, the survey shows.

The share of all-cash sales among vacation homes saw the biggest increase, jumping to 61% in April compared to 50% over recent years.

As you know the Pinellas Gulf Coast is a vacation home mecca. Let’s see how our beach communities stack up against the rest of the country.30 Year Fixed Rates 

It’s also worth noting the total number of sales for the month of April of each year.

2019  =  256

2020  =  150

2021  =  378

Interesting to see how the market is playing catch up from April of 2020.

Posted in: Uncategorized

Typical Homeowner in Forbearance has plenty of Home Equity

The COVID-19 pandemic’s devastating impact on the job market has left many households unable to pay their mortgages or rents. Fortunately, the speedy intervention provided by the CARES Act ensured mortgage forbearance options for homeowners who were financially harmed by the pandemic.

A typical homeowner in forbearance appears to have sizeable equity in their home, with median equity just over $100,000 and loan to value ratio[2] at about 61%. Even after accounting for missed mortgage payments, a typical homeowner in a forbearance is estimated to have about $88,000 in equity — which is generally more than enough to cover the costs of selling a home and still have some equity left over.

There are still over 2 million borrowers in forbearance with about half of them at least 180 days behind on their mortgage payments. Among borrowers in forbearance, 2.9% are still in negative equity, or about 58,000 loans.

Posted in: Uncategorized

Are we in a housing bubble or a vacuum?

Remember when housing prices Nationwide started falling in 2007 and bottomed out in 2011? The period in history was known as The Great Recession.

The term “housing bubble” summed up that miserable period. The bubble was created by speculation and fueled by easy mortgage money.

Let’s compare some key factors of the Great Recession to today’s environment.

In 2006 the demand was driven by speculation. Today it’s driven by end users.

When the bubble burst in 2006 we had a 20-month supply of homes for sale. Today we have a 2-month supply.

New home construction was way up in 2006… today builders can’t build fast enough to keep up with demand. With the cost of construction increasing, it’s likely supply won’t catch up with demand anytime soon.

In 2006 a 30-year fixed rate loan was 6%. Today it’s 3%.

But here’s the really significant piece of data. Take a look at this graph.

Basically, the higher the number on the vertical axis the easier it is to qualify for a mortgage.

You can see It was pretty loose in 2006. But by 2008 everything changed. It dropped like a Double Black Diamond ski slope. It’s been remained flat at that level for the last 12 years. The bottom line is that people who have mortgages on their homes now are much better qualified and those loans are very well underwritten.

But what about all the potential foreclosures once Federal moratoriums are lifted?

Consider this. According to the Mortgage Bankers Association, 62% of all US homes have a mortgage. Taken together, EQUITY for those mortgaged properties surged to more than $1.5 trillion. That’s an increase of more than 16.2% from a year earlier.

As of March 1st 2021, 4.96% of all mortgages were in forbearance. That’s down from 8.55% in June of 2020.

It’s hard to say how many of the remaining borrowers in forbearance have either experienced a real hardship or are just taking advantage of the fact they haven’t had to make a mortgage payment for the last 12 months.

In any case, it seems most will have enough equity to sell or refinance to avoid foreclosure.

Posted in: Uncategorized

Vacation Home Buyers Storm the Beaches

An article in yesterdays Wall Street Journal entitled “Vacation Home Buyers Propped Up the Mortgage Market” stated “The pandemic set in motion a furious scramble to buy vacation homes”. The article went on to say that the number of buyers who locked in mortgage rates on second homes in February was up 93% from a year earlier. That is nearly triple the increase for mortgages on primary residences.

Bringing it closer to home, take a look at our market here for Gulf Front Condos for the 1st quarter of 2020 vs 2021.

Its plain to see that many buyers chose our Gulf Beaches for their place in the sun. Many choose to take advantage of low mortgage rates but you may be surprised to know that half of these buyers paid cash.

Posted in: Uncategorized

Pandemic Ushers in a New Breed of Movers: Snowmads, Zoombirds

As remote work grows during the pandemic, so has the flexibility to move more freely. For some remote workers, that has meant taking their laptops and heading to home rentals along the beach.

Some are testing out new spots of the country by booking Airbnbs or short-term rentals in warmer destinations during the winter. The short-term rental site Vrbo reports these “snowmads” are often targeting vacation homes in warmer climates like Arizona, California, and Florida—where long-term stays have been stretching 15 days or more.

This pattern of heading to warmer climates in the winter was once reserved mostly for retirees. Now, it’s becoming an alluring possibility for the growing remote workforce who are no longer tethered to an office.  Read full article

Posted in: Uncategorized

Va K shaped recovery

Demand for Vacation Homes in U.S. Spikes 84 % in Early 2021

The annual rise in second-home mortgage applications is more than double the increase in applications for primary homes. Symbolizing Uneven Financial Recovery in the U.S.

The continued popularity of vacation homes is indicative of the rise in remote work due to the coronavirus pandemic. With white-collar workers able to work remotely and children learning from home, many affluent Americans are opting to spend at least part of their time outside of densely packed cities and decamping to vacation destinations. The demand for second homes is also representative of the K-shaped economic recovery from the pandemic-driven recession, with scores of lower-income Americans continuing to suffer financially while many high earners benefit from skyrocketing home values and well-performing stock portfolios.
Read the full story


Posted in: Uncategorized Tagged: Florida, K shaped recovery, vacation homes

Bidding Wars in 2021

A recent Article in The Wall Street Journal reported home buyers across the U.S. are finding themselves in bidding wars due to a reduced supply of homes on the market.

I can relate… Last week I listed a very presentable atrium style home in Belleair. The property went on the market Thursday evening. Seven showings Friday, eight showings Saturday and six written offers on my desk to evaluate by Monday morning.

There are several determining factors influencing which buyer my seller and I decided to go to contract with. Obviously, price is a factor, but only one offer was below list price and the rest offered list price or above. Enter terms and conditions.

First on the list is financing. One offer was cash but when I asked his agent to “show me the money” this buyer couldn’t put his money where his mouth was. One down, five to go. Some of the offers were accompanied by “pre-approval” letters from lenders while some promised to provide the same within a day or two. In my experience some of these letters are not worth the paper they are written on. Buyer calls a loan officer, tells the loan officer where they work, how much they make, what they have to put down etc. and the loan officer says “based on what you are telling me” you are good to go then proceeds to email a non-binding pre-approval / pre-qualification letter to the buyer and his agent. When I am representing a seller, we don’t start negotiating until I speak to the lender and ask some basic underwriting questions. Is the buyer Self Employed? Have you run credit? Do you have the buyers tax returns or W2s? Has the buyer provided you with bank statements for down payment verification? Let’s just say the lender who took my call and answered all the above in the affirmative and who also happens to have a great reputation carried a lot of weight.

Next let’s consider the closing date. Does it work for my seller? Generally speaking, a shorter escrow period is desirable unless the seller needs more time. The longer the escrow the more risk because “life happens” as they say.

Next let’s make sure the earnest money deposit is adequate based on the price and length of escrow. Generally a larger deposit is better but I have seen buyers stick to $5,000 like glue while some walk away from tens of thousands if they choose to default on a contract.

Now comes the Professional Inspection contingency. Again, the shorter the better as most contracts now are written with an AS IS WITH RIGHT TO INSPECT clause. The standard language in these contracts gives the buyer the absolute right of withdrawal at the buyer’s sole discretion for any reason prior to the expiration of the inspection period. If that happens the buyers earnest money deposit is returned and they are released from any further obligation. According to the contract, this cancelation is the buyers sole remedy and in turn does not obligate the seller to make any repairs. However, many times in practice what happens is the buyer requests the seller make repairs or financial concessions in lieu of canceling the deal entirely. But that is an entirely different discussion.

Last but not least is the capability and professionalism of the agent representing the buyer. This can vary widely as the “barriers to entry” to obtaining a real estate license are minimal and basically involves passing a reading test. Couple that with the fact many brokers will hire anybody that has a license and a pulse explains why the failure rate for Real Estate agents is a whopping 87% nationally. I digress, but let’s just say when you get to work with a PRO on the other side of a deal it makes a huge difference.

As it turns out, the buyer represented by the best agent who was working with the best lender came up with an offer we couldn’t refuse. Oh, and by the way, my seller got 2.5% over list price.

Posted in: Uncategorized

2020 Was Quite a Ride

Coastal Real Estate Market Summary Pinellas Beaches All Residential Properties

Condos – Homes – Townhomes – 1 to 4 Units

Waterfront and Non Waterfront

St. Pete Beach – Treasure Island – Madeira Beach – Redington Beaches – Indian Shores – Indian Rocks Beach

In all my years in the Real Estate business I’ve seen many market changes, but I think you’ll agree: 2020 is in a class all by itself. It was a strange combination of unforeseen events taking place in a contentious election year. For some perspective, consider a comparison of the 2019 & 2020 markets for our beach communities here in Pinellas County.

In the first quarter of 2020 sales volume was trending up accompanied by a softening of prices. The World Health Organization declares Covid-19 a Pandemic on March 11th and everything changes. Most of the deals in escrow close in March but closings take a nose dive in April and May as buyers cancel, sellers withdraw from the market and lenders tighten underwriting guidelines. In June the market hits an inflection point and begins to make up for lost time. The market experiences a sharp increase in volume and average selling price, exceeding Pre-Pandemic Levels, with 40% of buyers paying cash in spite of record low mortgage rates.

Number of Sales for the year net increase of 20%

4th Quarter year over year increase in Average Sales Price of 12%

These trends continued through year end. Supply shrank as sellers decided stay put while many owners chose to re-finance at historically low rates. Coming in to 2021 supply remains short, mortgage rates are low and buyers need to be prepared to act fast on fairly priced properties.

Compiled from Stellar MLS including: Condos – Homes – Townhomes – 1 to 4 Units,  Gulf Front, Bay Front and Off Water 

St. Pete Beach – Treasure Island – Madeira Beach – Redington Beach—North Redington—Redington Shores – Indian Shores – Indian Rocks Beach


Posted in: Uncategorized

Posts navigation

  • 1
  • 2
  • Next Page »

Properties

5820 Balao Way S
$3,500,000
  • 4 Bedrooms
  • 5 Bathrooms
  • 3,489 Sq Ft
  • 0.18 Acres

5820 Balao Way S St Pete Beach, Florida

View Property

225 Boca Ciega Drive
$3,500,000
  • 10 Bedrooms
  • 10 Bathrooms
  • 4,885 Sq Ft
  • 0.44 Acres

225 Boca Ciega Drive Madeira Beach, Florida

View Property

14 Sunset Bay Drive
$2,990,000
  • 4 Bedrooms
  • 5 Bathrooms
  • 3,595 Sq Ft
  • 0.21 Acres

14 Sunset Bay Drive Belleair, Florida

View Property

305 Harbor Drive
$2,860,000
  • 4 Bedrooms
  • 4 Bathrooms
  • 3,042 Sq Ft
  • 0.15 Acres

305 Harbor Drive Indian Rocks Beach, Florida

View Property

344 Capri Boulevard
$2,750,000
  • 5 Bedrooms
  • 5 Bathrooms
  • 3,638 Sq Ft
  • 0.12 Acres

344 Capri Boulevard Treasure Island, Florida

View Property

139 Wall Street
$2,500,000
  • 4 Bedrooms
  • 4 Bathrooms
  • 3,514 Sq Ft
  • 0.14 Acres

139 Wall Street Redington Shores, Florida

View Property

16025 Redington Drive
$2,450,000
  • 4 Bedrooms
  • 5 Bathrooms
  • 2,695 Sq Ft
  • 0.2 Acres

16025 Redington Drive Redington Beach, Florida

View Property

460 137th Avenue Circle
$1,999,999
  • 4 Bedrooms
  • 4 Bathrooms
  • 2,804 Sq Ft
  • 0.09 Acres

460 137th Avenue Circle Madeira Beach, Florida

View Property

11625 5th Street E
$1,795,000
  • 4 Bedrooms
  • 4 Bathrooms
  • 2,438 Sq Ft
  • 0.33 Acres

11625 5th Street E Treasure Island, Florida

View Property

300 10th Avenue
$1,700,000
  • 3 Bedrooms
  • 2 Bathrooms
  • 1,434 Sq Ft
  • 0.18 Acres

300 10th Avenue Indian Rocks Beach, Florida

View Property

324 6th Avenue
$1,650,000
  • 2 Bedrooms
  • 3 Bathrooms
  • 2,120 Sq Ft
  • 0.15 Acres

324 6th Avenue Indian Rocks Beach, Florida

View Property

425 12th Avenue
$1,399,000
  • 3 Bedrooms
  • 3 Bathrooms
  • 1,950 Sq Ft
  • 0.16 Acres

425 12th Avenue Indian Rocks Beach, Florida

View Property

4 Belleview Boulevard 802
$1,200,000
  • 3 Bedrooms
  • 2 Bathrooms
  • 1,200 Sq Ft
  • 2.27 Acres

4 Belleview Boulevard 802 Belleair, Florida

View Property

19519 Gulf Boulevard 203
$1,199,877
  • 3 Bedrooms
  • 2 Bathrooms
  • 1,560 Sq Ft
  • 2.45 Acres

19519 Gulf Boulevard 203 Indian Shores, Florida

View Property

326 176th Avenue Circle
$1,195,000
  • 3 Bedrooms
  • 2 Bathrooms
  • 1,980 Sq Ft
  • 0.15 Acres

326 176th Avenue Circle Redington Shores, Florida

View Property

Lead Sign Up

Contact Us

Doiron Realty Services
727-391-2829
broker@doironrealty.com
© 2025 · Privacy Policy · Equity Framework


© 2025 · Equity Framework